Turn your data into something beautiful. Instantly.
Upload your CSV, pick a chart type, download and go.
No tutorials. No faff.
Just great looking charts.
Your data never leaves your browser. Ever.
- Try for free
- No sign up needed
- PNG export
- Works with any CSV
 Try for free
See it in action
From CSV to beautiful chart in 25 seconds.
How it works
It's as easy as 1, 2, 3
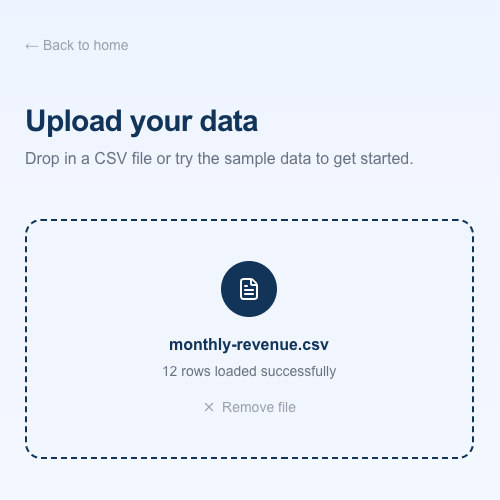
1. Upload
Drop in your CSV file. Or paste your data directly.
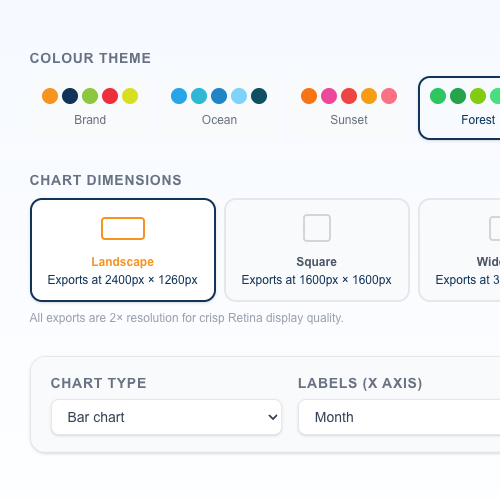
2. Customise
Pick your chart type. Adjust colours. Make it yours.
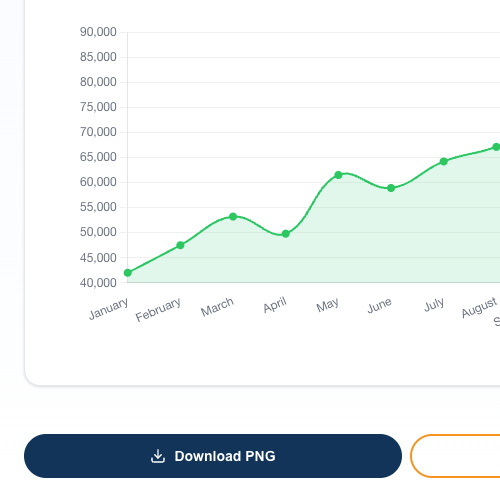
3. Download
Export your PNG file. Job done.
Free to get started. No credit card needed.
Every chart you'll ever need
Pick a chart type and we'll do the rest.
Bar chart
Compare values side by side
Line chart
Show trends over time
Doughnut chart
Break down percentages at a glance
Horizontal bar chart
Compare categories clearly
Scatter plot
Spot patterns in your data
Area chart
Show volume over time
Pie chart
Simple proportions at a glance
Bubble chart
Show data in three dimensions
Simple pricing.
No surprises.
Free forever. Upgrade if you want more.
Free
£0 forever
- 5 chart exports per month
- 8 chart types
- PNG export
- Standard dimension presets
- Works with any CSV
- Exports include watermark
- No credit card needed
Free forever. No credit card needed.
Pro
£8 /month
- Everything in Free
- Unlimited chart exports
- No watermark on exports
- Transparent background export
- Custom brand colour picker
- Extended dimension presets
- Priority support (responses within 24 hours)
Cancel anytime. No questions asked.
Questions and Answers
Your next chart is 25 seconds away.
No signup. No credit card.
No learning curve.
Just drop in your CSV and
watch the magic happen.
Join the people already turning boring spreadsheets into beautiful charts.